Français
 Italiano
此SVG文件的PNG预览的大小:600 × 480像素。 其他分辨率:300 × 240像素 | 960 × 768像素 | 1,280 × 1,024像素 | 2,560 × 2,048像素。
原始文件 (SVG文件,尺寸为600 × 480像素,文件大小:9 KB)
摘要
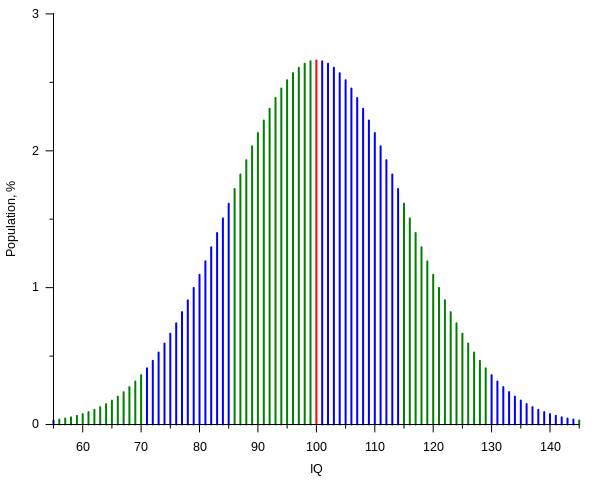
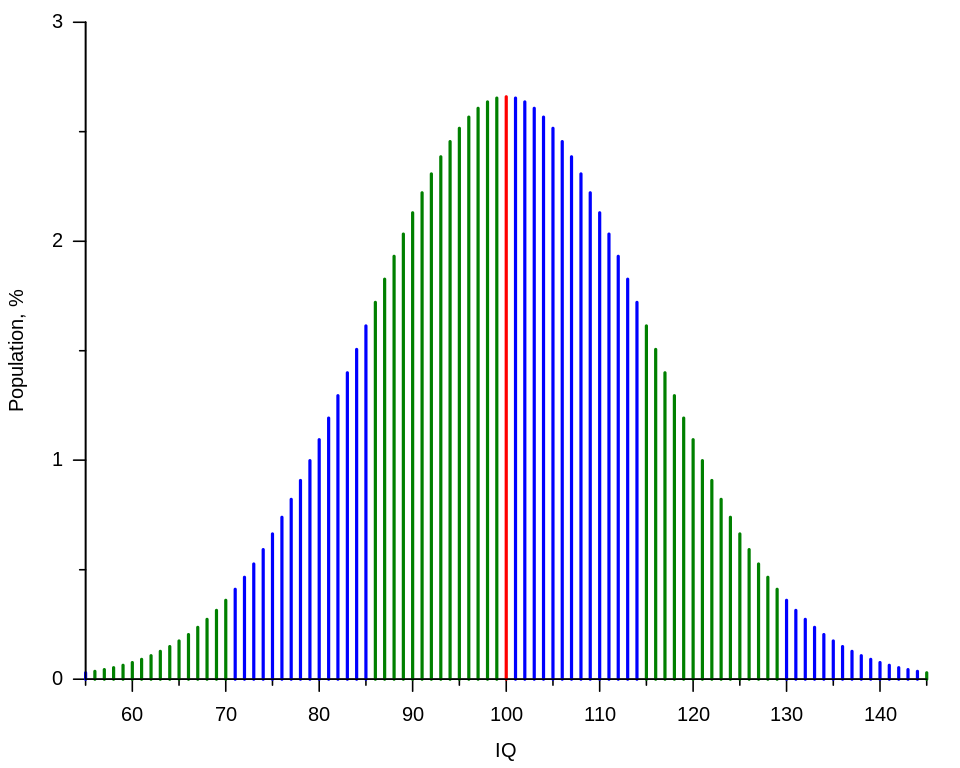
| 描述 | Current IQ tests typically have standard scores such that the mean score is 100 with each standard deviation from the mean counting for 15 IQ points.[1] The plot shows, assuming that such scores have a normal distribution, the percentage of people getting a score versus the score itself, from 55 to 145 IQ, that is over a span of six standard deviations. Spans are represented with different colors for each standard deviation above or below the mean. The plot was created with the following gnuplot code: |
| SVG开发 | |
| 源代码 | Gnuplot codeset terminal svg name 'IQ_curve' size 600,480 font ',10' rounded set output 'IQ_curve.svg' mu = 100.0 sigma = 15.0 from = 55 to = 145 # Normal distribution: # (continuos normalization approximation, good to ~10 digits in this case) P(x) = exp(-(x - mu)**2 / (2 * sigma**2)) / (sqrt(2 * pi) * sigma) * 100 # By sigma intervals: oddsi(x) = (int(abs(x - mu) / sigma) % 2) ^ (x < mu) Pm(x) = (x == mu) ? P(x) : 1/0 # sample at mu Po(x) = ( oddsi(x) && (x != mu)) ? P(x) : 1/0 # samples in odd sigma intervals Pe(x) = (!oddsi(x) && (x != mu)) ? P(x) : 1/0 # samples in even sigma intervals set key off set border 3 set xlabel 'IQ' set xtics 10 out nomirror set mxtics 2 set ylabel 'Population, %' set ytics 1 out nomirror set mytics 2 set samples (to - from + 1) set style function impulses plot [x = from:to] \ Pm(x) lw 2, \ Po(x) lw 2, \ Pe(x) lw 2 |
| 日期 | |
| 来源 | 自己的作品 |
| 作者 | Alessio Damato, Mikhail Ryazanov |
- ↑ Kaufman, A.S. (2009年) 《 IQ Testing 101》、New York (NY): Springer Publishing、pp. 104−109 ISBN: 978-0-8261-0629-2.
许可协议
我,本作品著作权人,特此采用以下许可协议发表本作品:
 | 已授权您依据自由软件基金会发行的无固定段落及封面封底文字(Invariant Sections, Front-Cover Texts, and Back-Cover Texts)的GNU自由文件许可协议1.2版或任意后续版本的条款,复制、传播和/或修改本文件。该协议的副本请见“GNU Free Documentation License”。 |
| 本文件采用知识共享署名-相同方式共享 3.0 未本地化版本许可协议授权。 | ||
| ||
| 本许可协议标签作为GFDL许可协议更新的组成部分被添加至本文件。 |
- 您可以自由地:
- 共享 – 复制、发行并传播本作品
- 修改 – 改编作品
- 惟须遵守下列条件:
- 署名 – 您必须对作品进行署名,提供授权条款的链接,并说明是否对原始内容进行了更改。您可以用任何合理的方式来署名,但不得以任何方式表明许可人认可您或您的使用。
- 相同方式共享 – 如果您再混合、转换或者基于本作品进行创作,您必须以与原先许可协议相同或相兼容的许可协议分发您贡献的作品。
您可以选择您需要的许可协议。
文件历史
点击某个日期/时间查看对应时刻的文件。
| 日期/时间 | 缩略图 | 大小 | 用户 | 备注 | |
|---|---|---|---|---|---|
| 当前 | 2024年11月18日 (一) 22:29 | | 600 × 480(9 KB) | Dr. Greywolf | File uploaded using svgtranslate tool (https://svgtranslate.toolforge.org/). Added translation for yue. |
| 2020年11月27日 (五) 07:11 |  | 600 × 480(9 KB) | Paranaja | Reverted to version as of 21:27, 2 November 2012 (UTC) | |
| 2012年11月3日 (六) 05:27 |  | 600 × 480(9 KB) | Mikhail Ryazanov | IQ values are now integers; gnuplot-only approach | |
| 2006年12月6日 (三) 17:20 |  | 600 × 480(12 KB) | Alejo2083 | {{Information |Description= The IQ test is made so that most of the people will score 100 and the distribution will have the shape of a Gaussian function, with a standard deviation of 15. The plot shows the percentage of people getting a score versus the |
文件用途
没有页面使用本文件。
全域文件用途
以下其他wiki使用此文件:
- ar.wikipedia.org上的用途
- ast.wikipedia.org上的用途
- az.wikipedia.org上的用途
- ba.wikipedia.org上的用途
- be-tarask.wikipedia.org上的用途
- be.wikipedia.org上的用途
- ca.wikipedia.org上的用途
- cs.wikipedia.org上的用途
- da.wikipedia.org上的用途
- de.wikipedia.org上的用途
- de.wikibooks.org上的用途
- Elementarwissen medizinische Psychologie und medizinische Soziologie: Theoretisch-psychologische Grundlagen
- Elementarwissen medizinische Psychologie und medizinische Soziologie/ Druckversion
- Elementarwissen medizinische Psychologie und medizinische Soziologie/ Test
- Benutzer:OnkelDagobert:Wikilinks:Psychologie
- de.wikiversity.org上的用途
- en.wikipedia.org上的用途
- User:Michael Hardy
- User:Robinh
- User:Itsnotvalid
- User:M.e
- User:Quandaryus
- User:Astronouth7303
- User:Mattman723
- User:Iothiania
- User:Octalc0de
- Portal:Mathematics/Featured picture archive
- User:Dirknachbar
- User talk:BlaiseFEgan
- User:Albatross2147
- User:Klortho
- User:Kvasir
- User:Spellcheck
- User:Heptadecagram
- User:Adam Taaluma
- User:NeonMerlin/boxes
- User:Cswrye
- User:Harm.frielink
查看此文件的更多全域用途。
元数据
Explore the world
United states
New York
Japan
Tokyo
Singapore
Singapore