Français
 Italiano
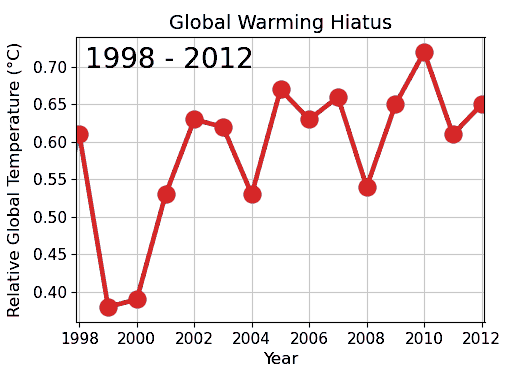
Нет версии с бо́льшим разрешением.
Global_warming_hiatus.gif (509 × 370 пкс, размер файла: 326 КБ, MIME-тип: image/gif, закольцованный, 38 фреймов, 18 с)
Краткое описание
| Описание | English: By selecting or cherry-picking data, the trend of global warming appears to mistakenly stop, as in the period from 1998 to 2012, which is actually a random contrary fluctuation. |
| Дата | |
| Источник | Собственная работа |
| Автор | Physikinger |
| Другие версии | German version File:Vermeindlicher Stillstand der globalen Erwaermung.gif |
| GIF‑разработка | Это plot было создано с помощью Matplotlib |
| Исходный код | Python codeimport numpy import matplotlib.pyplot as plt import imageio year_T = { # https://data.giss.nasa.gov/gistemp/tabledata_v4/GLB.Ts+dSST.txt # GLOBAL Land-Ocean Temperature Index in 0.01 degrees Celsius # base period: 1951-1980 # sources: GHCN-v4 1880-07/2021 + SST: ERSST v5 1880-07/2021 # using elimination of outliers and homogeneity adjustment # Divide by 100 to get changes in degrees Celsius (deg-C). # Year: Temperature (Column J-D, annual mean Temperature Jan to Dec) 1880: -18, 1881: -10, 1882: -12, 1883: -18, 1884: -29, 1885: -34, 1886: -32, 1887: -37, 1888: -18, 1889: -11, 1890: -36, 1891: -23, 1892: -28, 1893: -32, 1894: -31, 1895: -23, 1896: -12, 1897: -12, 1898: -28, 1899: -18, 1900: -9, 1901: -16, 1902: -29, 1903: -38, 1904: -48, 1905: -27, 1906: -22, 1907: -39, 1908: -43, 1909: -49, 1910: -44, 1911: -44, 1912: -37, 1913: -35, 1914: -16, 1915: -15, 1916: -37, 1917: -46, 1918: -30, 1919: -28, 1920: -28, 1921: -19, 1922: -29, 1923: -27, 1924: -27, 1925: -22, 1926: -11, 1927: -22, 1928: -20, 1929: -36, 1930: -16, 1931: -10, 1932: -16, 1933: -28, 1934: -12, 1935: -20, 1936: -15, 1937: -3, 1938: 0, 1939: -2, 1940: 12, 1941: 18, 1942: 6, 1943: 9, 1944: 20, 1945: 9, 1946: -7, 1947: -3, 1948: -11, 1949: -11, 1950: -17, 1951: -7, 1952: 1, 1953: 8, 1954: -13, 1955: -14, 1956: -19, 1957: 5, 1958: 6, 1959: 3, 1960: -3, 1961: 6, 1962: 3, 1963: 5, 1964: -20, 1965: -11, 1966: -6, 1967: -2, 1968: -8, 1969: 5, 1970: 3, 1971: -8, 1972: 1, 1973: 16, 1974: -7, 1975: -1, 1976: -10, 1977: 18, 1978: 7, 1979: 16, 1980: 26, 1981: 32, 1982: 14, 1983: 31, 1984: 16, 1985: 12, 1986: 18, 1987: 32, 1988: 39, 1989: 27, 1990: 45, 1991: 40, 1992: 22, 1993: 23, 1994: 31, 1995: 44, 1996: 33, 1997: 47, 1998: 61, 1999: 38, 2000: 39, 2001: 53, 2002: 63, 2003: 62, 2004: 53, 2005: 68, 2006: 64, 2007: 66, 2008: 54, 2009: 66, 2010: 73, 2011: 61, 2012: 65, 2013: 68, 2014: 75, 2015: 90, 2016: 101, 2017: 92, 2018: 85, 2019: 98, 2020: 101, 2021: 85, 2022: 89, 2023: 117, 2024: 128 } x, y = (numpy.array(list(x()), dtype='d') for x in (year_T.keys, year_T.values)) y = y / 100 xMinFocus, xMaxFocus = 1998, 2012 i0 = x.tolist().index(xMinFocus) i1 = x.tolist().index(xMaxFocus) + 1 nPoly = 4 phi = numpy.array([x**i for i in range(nPoly)]) A = phi @ phi.T b = phi @ y c = numpy.linalg.solve(A, b) yPoly = c @ phi phiHist = phi[:,:i1] A = phiHist @ phiHist.T b = phiHist @ y[:i1] c = numpy.linalg.solve(A, b) yPolyHist = c @ phi nPoly = 3 phiF = phi[:nPoly,i0:i1] A = phiF @ phiF.T b = phiF @ y[i0:i1] c = numpy.linalg.solve(A, b) yPolyFocus = c @ phi[:nPoly] yMinTotal, yMaxTotal = numpy.min(y) - 0.02, numpy.max(y) + 0.02 xMinTotal, xMaxTotal = numpy.min(x), numpy.max(x) yMinFocus, yMaxFocus = numpy.min(y[i0:i1]) - 0.02, numpy.max(y[i0:i1]) + 0.02 plt.xlim(xMinFocus-0.1, xMaxFocus+0.5) # Frame-Parameter: # t: Frame duration # trans1: transition 0 to 1 towards full time frame # trans2: transition 0 to 1 towards full data set # showTrend: Trend (0: None, 1: Zoom, 2: full history, 3: full time frame) parameters = [ # (t, trans1, trans2, showTrend) (1, 0.0, 0.0, 0), (4, 0.0, 0.0, 1), *[(0.1, t**2, 0.0, 1) for t in numpy.linspace(0,1,25)], (1.0, 1.0, 0.0, 1), (0.5, 1.0, 0.0, 0), (1, 1.0, 0.0, 2), *[(0.1, 1.0, t,2) for t in numpy.linspace(0,1,10)], (0.5, 1.0, 1.0, 2), (6, 1.0, 1.0, 3), ] images = [] duration = [] for t, trans1, trans2, showTrend in parameters: duration.append(t) zoom = 4*(1-trans1) + 1*trans1 fig = plt.figure(figsize=(5.1,3.7), dpi=100) plt.rc('axes', titlesize=14, labelsize=12) plt.rc('xtick', labelsize=11) plt.rc('ytick', labelsize=11) plt.rc('legend', fontsize=16) if showTrend == 1: plt.plot(x[i0-15:], yPolyFocus[i0-15:], 'r--', label='Trend') if showTrend == 2: plt.plot(x, yPolyHist, 'b--', label='Trend') if showTrend == 3: plt.plot(x, yPoly, 'b--', label='Trend') iMax = int(i1 + trans2*(len(x)-i1)) plt.plot(x[:iMax], y[:iMax], 'C0.-', alpha=0.8, linewidth=0.8*zoom, markersize=6*zoom) plt.plot(x[i0:i1], y[i0:i1], 'C3.-', linewidth=0.805*zoom, markersize=6.05*zoom) plt.grid(True, alpha=0.7) yMax = yMaxFocus + trans1*(yMaxTotal-yMaxFocus) xMax = xMaxFocus + trans1*(xMaxTotal-xMaxFocus) xMin = xMinFocus*(1-trans1) + xMinTotal*trans1 plt.xlim(xMin-0.1, xMax+0.1+1*trans1) plt.ylim(yMinFocus*(1-trans1) + yMinTotal*trans1, yMaxFocus*(1-trans1) + yMax*trans1+0.03*trans1) plt.text(0.02, 0.89, '%i - %i'%(xMin, x[iMax-1]), transform=plt.gca().transAxes, fontsize=20) plt.title('Global Warming Hiatus') plt.xlabel('Year') plt.ylabel('Relative Global Temperature (°C)') plt.gca().yaxis.set_label_coords(-0.13, 0.5) if showTrend: leg = plt.legend(frameon=False, loc='lower right') fig.subplots_adjust( top=0.9, bottom=0.13, left=0.15, right=0.95, hspace=0.2, wspace=0.2 ) fig.canvas.draw() s, (width, height) = fig.canvas.print_to_buffer() images.append(numpy.array(list(s), numpy.uint8).reshape((height, width, 4))) fig.clf() plt.close('all') # Save GIF animation fileOut = 'Global_warming_hiatus.gif' imageio.mimsave(fileOut, images, 'GIF', duration=[i*1000 for i in duration]) # Optimize GIF size from pygifsicle import optimize optimize(fileOut, colors=20, options=["--loop"]) |
Лицензирование
Я, владелец авторских прав на это произведение, добровольно публикую его на условиях следующей лицензии:
| Этот файл доступен на условиях Creative Commons CC0 1.0 Универсальной передачи в общественное достояние (Universal Public Domain Dedication). | |
| Лица, связанные с работой над этим произведением, решили передать данное произведение в общественное достояние, отказавшись от всех прав на произведение по всему миру в рамках закона об авторских правах (а также связанных и смежных прав), в той степени, которую допускает закон. Вы можете копировать, изменять, распространять и исполнять данное произведение в любых целях, в том числе в коммерческих, без получения на это разрешения автора.
|
История файла
Нажмите на дату/время, чтобы увидеть версию файла от того времени.
| Дата/время | Миниатюра | Размеры | Участник | Примечание | |
|---|---|---|---|---|---|
| текущий | 19:44, 23 февраля 2025 | | 509 × 370 (326 КБ) | Physikinger | Regenerated (Bug in loop) |
| 13:54, 12 января 2025 |  | 509 × 370 (326 КБ) | Physikinger | Update 2024 | |
| 23:52, 17 апреля 2023 |  | 509 × 370 (500 КБ) | Physikinger | Shorter red line | |
| 21:36, 13 апреля 2023 |  | 509 × 370 (511 КБ) | Physikinger | Extrapolation, Timing | |
| 00:01, 13 апреля 2023 |  | 509 × 370 (510 КБ) | Physikinger | Update 2022, single zoom transition | |
| 15:37, 7 сентября 2021 |  | 509 × 370 (511 КБ) | Physikinger | Smaller file size | |
| 01:09, 7 сентября 2021 |  | 509 × 370 (617 КБ) | Physikinger | Fixed label, less colors | |
| 22:01, 1 сентября 2021 |  | 509 × 370 (884 КБ) | Physikinger | Uploaded own work with UploadWizard |
Использование файла
Нет страниц, использующих этот файл.
Глобальное использование файла
Данный файл используется в следующих вики:
- Использование в azb.wikipedia.org
- Использование в bg.wikipedia.org
- Использование в da.wikipedia.org
- Использование в en.wikipedia.org
- Использование в eo.wikipedia.org
- Использование в et.wikipedia.org
- Использование в fr.wikipedia.org
- Использование в he.wikipedia.org
- Использование в id.wikipedia.org
- Использование в it.wikipedia.org
- Использование в ja.wikipedia.org
- Использование в mk.wikipedia.org
- Использование в pfl.wikipedia.org
- Использование в uk.wikipedia.org
- Использование в www.wikidata.org
- Использование в zh-yue.wikipedia.org
- Использование в zh.wikipedia.org
Explore the world
United states
New York
Japan
Tokyo
Singapore
Singapore