Français
 Italiano
Oorspronkelijk bestand (8.859 × 11.506 pixels, bestandsgrootte: 75,71 MB, MIME-type: image/png)
Dit is een bestand van Wikimedia Commons. Onderstaande beschrijving komt van de beschrijving van het bestand daar. Commons is een vrij-gelicenceerde database voor afbeeldingen, geluid, video en andere bestanden. |
Beschrijving
| Beschrijving | English: The image shows a poster, meant for A0 printing or just enjoying on the screen. The image is an artwork, created by me. It is compiled from multiple, free sources, listed at the 'original source' section. The image puts home (earth and our solar system) into perspective of the universe as far as we know it. As an astronomer, it is particular difficult to provide a sense, or a feeling of the scale of the universe and everything that surrounds it. This poster is meant to help the astronomically interested person to feel what it means to live in this universe. The six artistic images on top and below as well as the milky way present a sense of the size of the known, nearby universe. The Planets diagram sets the earth and other planets of the solar system into the perspective of roughly 500 extrasolar planets that have been found and confirmed so far. The diagram does not actually show the distribution of planets as it is in reality, it is strongly biased due to our limits in observing small planets and planets with a large distance to the host star. The HR diagram puts the sun in relation of other, nearby suns. This diagram is also biased due to our limits of observing very cold, dark stars. The number of red dwars would outmatch the other stars by a huge amount, but we just can't see them. In connection with the HR diagram, the Galaxy image gives an impression how far we can see stars with our naked eyes in a clear, dark night without light pollution. The scale shows how far we can see stars, depending on their brightness. The lower left and lower right diagram gives a perspective of the size of the universe, as it changes over time. The observable universe shows how the universe developed in the past. The other is an estimation how it might develop in the future. The scale of the x-axis is different, otherwise it would be possible to attach both diagrams by turning one of them by 180deg. The estimated distances and times are based on calculations before the most recent plank data was released. The diagrams should give a sense how the universe expands, and how large it actually is.Central galaxy Image: composite from the annotated and not annotated version. Not annotated: File:Milky Way 2005.jpg original source: http://www.spitzer.caltech.edu/images/1927-ssc2008-10a1-The-Milky-Way-Galaxy annotated: File:236084main MilkyWay-full-annotated.jpg original source: http://www.spitzer.caltech.edu/images/1925-ssc2008-10b-A-Roadmap-to-the-Milky-Way-Annotated- Author: NASA/JPL-Caltech/R. Hurt |
| Datum | |
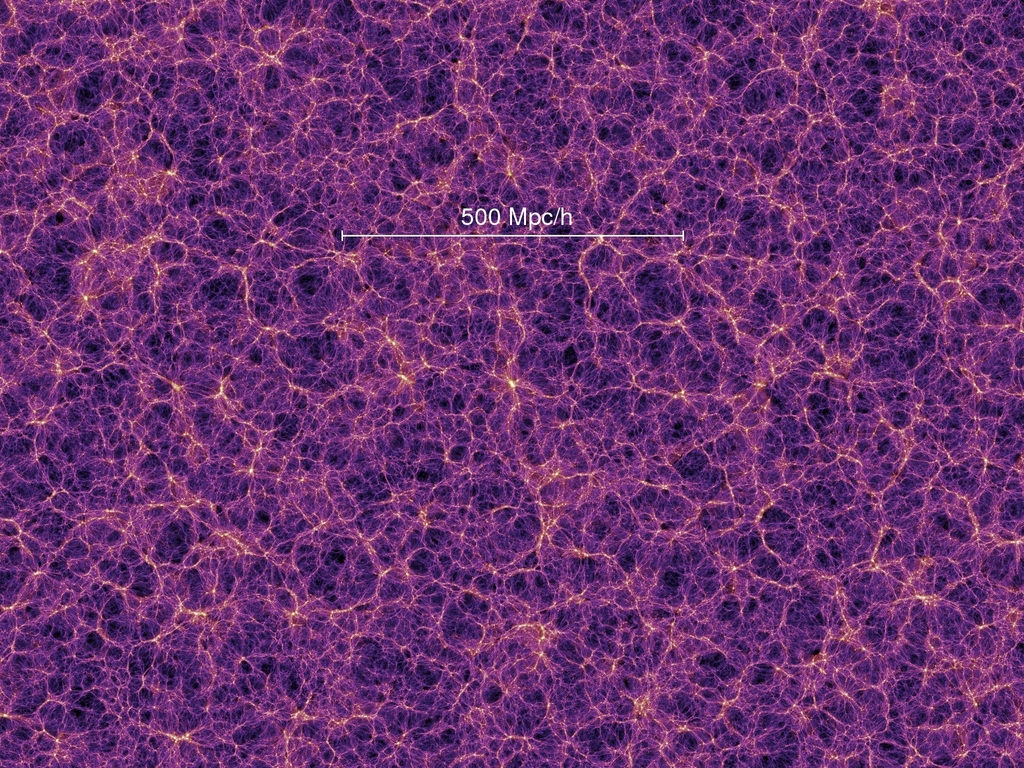
| Bron | 6 small images at the top and bottom: The not-annotated version is used and re-texted with a different font, matching the central galaxy image. The text information came from the annotated version. Some small errors were corrected though. File:Earth's Location in the Universe (JPEG).jpg Author: Andrew Z. Colvin Planets Diagram: This diagram is visually my own work. Data from http://www.exoplanets.org/ HR-Diagram: This diagram is visually my own work. Data is from Hiparcos Cataloge: Roughly 55,000 nearest stars, closer than paralexe 5 mas minus some manual selected stars that got in the way in the image. Hiparcos data source: http://vizier.u-strasbg.fr/viz-bin/VizieR Observable Universe and Reachable Universe: This diagram is visually my own work. I used the cosmic calculator to find initial values: http://www.astro.ucla.edu/~wright/CosmoCalc.html After that, I calculated the other information my self. Background: The background is a derived version from the cosmic web simulation from the "The Millennium Simulation Project", Max Plank Institute for Astrophysics. http://www.mpa-garching.mpg.de/galform/virgo/millennium/ Copyright statement for the background image ( http://www.mpa-garching.mpg.de/galform/data_vis/index.shtml ): When material of this page is used, credit has to be given to the author(s) as well as to the Max-Planck-Institute for Astrophysics. I hereby give credit to: Max-Plank Institute for Astrophysics and Springel et al. (Virgo Consortium). Dit bestand is afgeleid van: |
| Auteur |
|
|

.jpg)
Licentie
- De gebruiker mag:
- Delen – het werk kopiëren, verspreiden en doorgeven
- Remixen – afgeleide werken maken
- Onder de volgende voorwaarden:
- naamsvermelding – U moet op een gepaste manier aan naamsvermelding doen, een link naar de licentie geven, en aangeven of er wijzigingen in het werk zijn aangebracht. U mag dit op elke redelijke manier doen, maar niet zodanig dat de indruk wordt gewekt dat de licentiegever instemt met uw werk of uw gebruik van zijn werk.
- Gelijk delen – Als u het materiaal remixt, transformeert of erop voortbouwt, moet u uw bijdragen verspreiden onder dezelfde licentie als die van het origineel, of een licentie die daarmee verenigbaar is.
Bestandsgeschiedenis
Klik op een datum/tijd om het bestand te zien zoals het destijds was.
| Datum/tijd | Miniatuur | Afmetingen | Gebruiker | Opmerking | |
|---|---|---|---|---|---|
| huidige versie | 28 mrt 2019 13:12 | | 8.859 × 11.506 (75,71 MB) | RolandWinkler | Fixed a small error in the scale of the Earth, top-left panel. The numbers read now the correct distance from Earth centre (instead of half the correct distance as before). |
| 5 nov 2015 17:29 |  | 8.859 × 11.506 (75,89 MB) | Reaper35 | Reverted to version as of 11:41, 15 April 2013 (UTC): No more need for this, should work fine now. | |
| 15 apr 2013 14:13 |  | 2.953 × 3.835 (11,71 MB) | RolandWinkler | Reduced the resolution so that it can be displayed in thumbnails. | |
| 15 apr 2013 13:41 |  | 8.859 × 11.506 (75,89 MB) | RolandWinkler | User created page with UploadWizard |
Bestandsgebruik
Geen enkele pagina gebruikt dit bestand.
Globaal bestandsgebruik
Dit bestand wordt op de volgende andere wiki’s gebruikt:
- Gebruikt op en.wikipedia.org
- Gebruikt op en.wikiquote.org
- Laurence J. Peter
- Arthur Eddington
- Wikiquote:Quote of the day/January 2014
- Wikiquote:Quote of the day/January 18, 2014
- Wikiquote:Quote of the day/March 2014
- Wikiquote:Quote of the day/March 11, 2014
- Wikiquote:Quote of the day/October 2014
- Wikiquote talk:Quote of the day/October 12, 2014
- Wikiquote:Quote of the day/October 12, 2014
- Wikiquote:Quote of the day/September 2017
- Wikiquote:Quote of the day/September 16, 2017
- Wikiquote:Quote of the day/June 2018
- Wikiquote:Quote of the day/June 16, 2018
- Wikiquote:Quote of the day/March 2021
- Wikiquote:Quote of the day/March 5, 2021
- Wikiquote:Quote of the day/June 2022
- Wikiquote:Quote of the day/June 23, 2022
- Gebruikt op fr.wiktionary.org
- Gebruikt op mg.wikipedia.org
- Gebruikt op pnb.wikipedia.org
- تارہ جھرمٹ
- شکاری تارہ جھرمٹ
- اسمانی کھڑی لیک
- جوڑی تارہ جھرمٹ
- ہالی تارہ جھرمٹ
- کاں تارہ جھرمٹ
- ڈولفن تارہ جھرمٹ
- چھینی تارہ جھرمٹ
- تیر تارہ جھرمٹ
- بچھو تارہ جھرمٹ
- گرگٹ تارہ جھرمٹ
- مور تارہ جھرمٹ
- گھُگی تارہ جھرمٹ
- پورس تارہ جھرمٹ
- ہنس تارہ جھرمٹ
- شینہ تارہ جھرمٹ
- پیگاسس تارہ جھرمٹ
- خلا
- خاندان مجمع النجوم
- جاثی (خاندان مجمع النجوم)
- کرہ سماوی
- سانچہ:معلومات-فلکیات
- سانچہ:معلومات-فلکیات/دستاویز
- اجرام فلکی
- Gebruikt op sg.wiktionary.org
Metadata
Explore the world

United states
New York

Japan
Tokyo

Singapore
Singapore