Français
 Italiano
この SVG ファイルのこの PNG プレビューのサイズ: 512 × 341 ピクセル. その他の解像度: 320 × 213 ピクセル | 640 × 426 ピクセル | 1,024 × 682 ピクセル | 1,280 × 853 ピクセル | 2,560 × 1,705 ピクセル。
元のファイル (SVG ファイル、512 × 341 ピクセル、ファイルサイズ: 53キロバイト)
この画像は常に最新のものであることが求められます。必要に応じて自由に更新してください。 |
自動承認された利用者は、このファイルを同一の典拠から上書きすることができます。上書きに際しては、必ずガイドラインを遵守してください。
概要
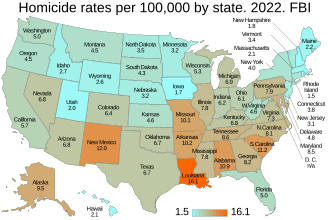
| 解説 | English: Homicide rates per 100,000 by state. US map. FBI. Federal Bureau of Investigation. See: List of U.S. states and territories by intentional homicide rate. D.C. is specifically not included because it is a federal district consisting of the city of Washington D.C.. Being a city, its much higher murder rate skews the 50-state spread for the states. |
| 日付 | - date of first upload to the Commons. See file history for later upload dates. |
| 原典 | Data from Crime Data Explorer. Federal Bureau of Investigation. At the bottom under 'Additional Datasets' find 'Summary Reporting System (SRS)' and click 'Download'. Rates are found by dividing the number of homicides by the population figure given, and multiplying by 100,000. |
| 作者 | Timeshifter, from template: File:Template map of US states and District of Columbia.svg. See instructions: File talk:Template map of US states and District of Columbia.svg/Instructions. |
| その他のバージョン | CDC: File:Homicide rates per 100,000 by state. CDC. US map.svg |
ライセンス
| This map is ineligible for copyright and therefore in the public domain, because it consists entirely of information that is common property and contains no original authorship. For more information, see Commons:Threshold of originality § Maps.
|
ファイルの履歴
過去の版のファイルを表示するには、その版の日時をクリックしてください。
| 日付と時刻 | サムネイル | 寸法 | 利用者 | コメント | |
|---|---|---|---|---|---|
| 現在の版 | 2024年3月5日 (火) 14:07 | | 512 × 341 (53キロバイト) | Timeshifter | Uploaded own work with UploadWizard |
ファイルの使用状況
このファイルを使用しているページはありません。
グローバルなファイル使用状況
以下に挙げる他のウィキがこの画像を使っています:
メタデータ
Explore the world
United states
New York
Japan
Tokyo
Singapore
Singapore