Français
 Italiano
L'Étang-Salé | |
|---|---|
 Beach of L'Étang-Salé | |
.svg) Coat of arms | |
 | |
Location of L'Étang-Salé  | |
| Coordinates: 21°15′58″S 55°22′01″E / 21.2661°S 55.3669°E | |
| Country | France |
| Overseas region and department | Réunion |
| Arrondissement | Saint-Pierre |
| Canton | L'Étang-Salé |
| Intercommunality | Villes solidaires |
| Government | |
| • Mayor (2022–2026) | Mathieu Hoarau[1] |
Area 1 | 38.65 km2 (14.92 sq mi) |
| Population (2022)[2] | 14,329 |
| • Density | 370/km2 (960/sq mi) |
| Time zone | UTC+04:00 |
| INSEE/Postal code | 97404 /97427 |
| Elevation | 0–1,781 m (0–5,843 ft) (avg. 31 m or 102 ft) |
| 1 French Land Register data, which excludes lakes, ponds, glaciers > 1 km2 (0.386 sq mi or 247 acres) and river estuaries. | |
L'Étang-Salé (French pronunciation: [letɑ̃ sale] ⓘ; French for The Salty Pond) is a commune in southwestern Réunion, a department in the Indian Ocean. It is bordered by the communes of Les Avirons and Saint-Louis. Within the commune is the Étang-Salé forest. There is also a beach with black sand in the commune that is a popular surfing spot.
Geography
[edit]Climate
[edit]L'Étang-Salé has a tropical savanna climate (Köppen climate classification Aw) closely bordering on a hot semi-arid climate (BSh). The average annual temperature in L'Étang-Salé is 23.6 °C (74.5 °F). The average annual rainfall is 619.5 mm (24.39 in) with February as the wettest month. The temperatures are highest on average in February, at around 27.1 °C (80.8 °F), and lowest in July, at around 20.1 °C (68.2 °F). The highest temperature ever recorded in L'Étang-Salé was 36.4 °C (97.5 °F) on 13 March 2004; the coldest temperature ever recorded was 8.0 °C (46.4 °F) on 15 August 1992.
| Climate data for L'Étang-Salé (1981−2010 normals, extremes 1961−2008) | |||||||||||||
|---|---|---|---|---|---|---|---|---|---|---|---|---|---|
| Month | Jan | Feb | Mar | Apr | May | Jun | Jul | Aug | Sep | Oct | Nov | Dec | Year |
| Record high °C (°F) | 36.2 (97.2) | 36.2 (97.2) | 36.4 (97.5) | 34.1 (93.4) | 33.0 (91.4) | 31.2 (88.2) | 29.8 (85.6) | 30.1 (86.2) | 31.0 (87.8) | 32.5 (90.5) | 33.9 (93.0) | 35.3 (95.5) | 36.4 (97.5) |
| Mean daily maximum °C (°F) | 32.1 (89.8) | 32.0 (89.6) | 31.6 (88.9) | 30.5 (86.9) | 28.6 (83.5) | 26.8 (80.2) | 26.0 (78.8) | 26.3 (79.3) | 26.9 (80.4) | 28.2 (82.8) | 29.6 (85.3) | 31.0 (87.8) | 29.1 (84.4) |
| Daily mean °C (°F) | 26.9 (80.4) | 27.1 (80.8) | 26.4 (79.5) | 25.2 (77.4) | 23.1 (73.6) | 21.1 (70.0) | 20.1 (68.2) | 20.3 (68.5) | 20.9 (69.6) | 22.3 (72.1) | 23.9 (75.0) | 25.7 (78.3) | 23.6 (74.5) |
| Mean daily minimum °C (°F) | 21.7 (71.1) | 22.3 (72.1) | 21.2 (70.2) | 19.9 (67.8) | 17.5 (63.5) | 15.5 (59.9) | 14.2 (57.6) | 14.1 (57.4) | 14.9 (58.8) | 16.3 (61.3) | 18.1 (64.6) | 20.4 (68.7) | 18.0 (64.4) |
| Record low °C (°F) | 16.0 (60.8) | 15.5 (59.9) | 15.1 (59.2) | 14.1 (57.4) | 10.0 (50.0) | 8.8 (47.8) | 9.1 (48.4) | 8.0 (46.4) | 9.9 (49.8) | 11.0 (51.8) | 12.3 (54.1) | 13.8 (56.8) | 8.0 (46.4) |
| Average precipitation mm (inches) | 93.0 (3.66) | 108.2 (4.26) | 90.2 (3.55) | 69.3 (2.73) | 41.6 (1.64) | 40.7 (1.60) | 37.2 (1.46) | 20.8 (0.82) | 18.7 (0.74) | 20.8 (0.82) | 25.1 (0.99) | 53.9 (2.12) | 619.5 (24.39) |
| Average precipitation days (≥ 1.0 mm) | 5.7 | 7.1 | 6.1 | 5.5 | 4.4 | 4.7 | 3.5 | 2.9 | 2.4 | 2.1 | 2.0 | 4.4 | 50.8 |
| Source: Météo-France[3] | |||||||||||||
Demography
[edit]| Year | Pop. | ±% p.a. |
|---|---|---|
| 1967 | 6,510 | — |
| 1974 | 6,610 | +0.22% |
| 1982 | 7,479 | +1.56% |
| 1990 | 8,769 | +2.01% |
| 1999 | 11,755 | +3.31% |
| 2007 | 13,179 | +1.44% |
| 2012 | 13,647 | +0.70% |
| 2017 | 13,894 | +0.36% |
| Source: INSEE[4] | ||
Economy and tourism
[edit]- there is an industrial zone in L'Étang-Salé
- a popular surfing beach in L'Étang-Salé-les-Bains
- several hotels
- an 18-hole golf course
- Croc' Park - a crocodile park
Images
[edit]
-
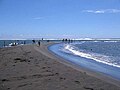 The beach of L'Étang-Salé
 -
 Surfer at L'Étang-Salé
 -
 Forest of L'Étang-Salé
 -
 The Gouffre - a lava formation at the coast


See also
[edit]References
[edit]- ^ "Répertoire national des élus: les maires" (in French). data.gouv.fr, Plateforme ouverte des données publiques françaises. 4 May 2022.
- ^ "Populations de référence 2022" (in French). The National Institute of Statistics and Economic Studies. 19 December 2024.
- ^ "Fiche Climatologique Statistiques 1981-2010 et records" (PDF) (in French). Météo-France. Retrieved August 29, 2022.
- ^ Population en historique depuis 1968, INSEE
External links
[edit]
This Réunion location article is a stub. You can help Wikipedia by expanding it. |
Explore the world
United states
New York
Japan
Tokyo
Singapore
Singapore