Français
 Italiano
Size of this PNG preview of this SVG file: 640 × 500 pixels. Other resolutions: 307 × 240 pixels | 983 × 768 pixels | 1,280 × 1,000 pixels | 2,560 × 2,000 pixels.
Original file (SVG file, nominally 640 × 500 pixels, file size: 15 KB)
This is a file from the Wikimedia Commons and may be used by other projects. Information from its description page there is shown below. Commons is a freely licensed media file repository. |
Summary
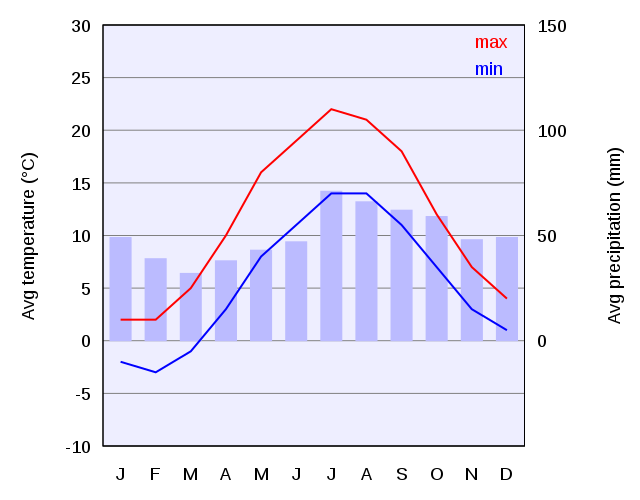
| Description | A climate chart of Copenhagen, Denmark. The red line depicts daytime high; blue is nighttime low. |
| Date | |
| Source | Self-made in gnuplot (source). Data obtained from BBC Weather Centre. |
| Author | Mysid |
Licensing
| This work has been released into the public domain by its author, Mysid. This applies worldwide. In some countries this may not be legally possible; if so: Mysid grants anyone the right to use this work for any purpose, without any conditions, unless such conditions are required by law. |
File history
Click on a date/time to view the file as it appeared at that time.
| Date/Time | Thumbnail | Dimensions | User | Comment | |
|---|---|---|---|---|---|
| current | 22:08, 1 August 2007 | | 640 × 500 (15 KB) | Mysid | == Summary == {{Information |Description=A climate chart of Copenhagen, Denmark. The red line depicts daytime high; blue is nighttime low. |Source=Self-made in gnuplot. Data obtained from [http://www.bbc.co.uk/weather/world/city_guides/results.shtml?tt=TT |
File usage
The following page uses this file:
Global file usage
The following other wikis use this file:
- Usage on bn.wikipedia.org
- Usage on da.wikipedia.org
- Usage on en.wikipedia.org
- Usage on et.wikipedia.org
- Usage on no.wikipedia.org
- Usage on pt.wikipedia.org
- Usage on uk.wikipedia.org
- Баланс зволоження
- Екваторіальна депресія
- Кліматична область
- Континентальний клімат
- Сніжник
- Дендрокліматологія
- Аридні області
- Аридний клімат
- Вікіпедія:Шаблони:Незавершені статті/Науки/Географія
- Кліматологія
- Шаблон:Climate-stub
- Антарктичний холодний реверс
- Геліотермічний показник
- Географія Данії
- Парселена
Metadata
Explore the world
United states
New York
Japan
Tokyo

Singapore
Singapore